This post contains the winning solution for the Stratio challenge 2015 developed by Marco Piva, Leonardo Biagioli, Fabio Fantoni and Andrea De Marco (BitBang).
The work describes the data model and the architecture of a Big Data Analytics solution that can help online advertisers to get fast answers for their analytical questions about impressions, clicks and purchases,basing on the Stratio Challenge requirements.
The emphasis is placed on the technologies that have been used, with particular focus on Spark and Spray.
Big Data analytics tools in Online Advertisement
We’re living in a world of 24/7 connectivity, accessing our content on our own terms, and we like it that way. Around the globe, 76% of respondents in a Nielsen online survey say they enjoy the freedom of being connected anywhere, anytime. While consumers love this flexibility, it represents a huge challenge for brands and online advertisers vying for our attention in a fragmented viewing arena.
Online Advertising is a relatively new discipline, born in the early 1990s along with the rise of the World Wide Web. After a few years dominated by basic web banners displayed on the major web sites, online companies started to experiment and to consolidate multiple formats and strategies to advertise their products, also defining standards and best practices about display advertising, search engine marketing, etc. According to IAB Internet Advertising Revenue Report, Internet advertising revenues in the USA reached the high of $12.4 billion during the third quarter of 2014, with a year-over-year growth that is continuing since 2010.
In this highly-demanding and ultra-competitive industry tools that support analysis and intelligence are essential: nobody wants to spend money on poor publishers, and every advertiser needs to have a scientific way to demonstrate how effective campaigns are in terms of ROAS (Return On Advertising Spending).
Analytics tools are becoming more and more complex and sophisticated in order to provide valuable insights on the marketing activities and results.
There are three major requirements for analytics tools today:
- Real-time: queries must run on datasets that are updated in real-time;
- Volume: collected data are frequently quantified in terms of terabytes (TBs) if not petabytes (PBs) on a daily basis;
- Velocity: queries on very large datasets must return results in a short time, basing on business needs.
- Provide the number of impressions, clicks and purchases in a given timeframe;
- Provide the metrics at point 1. grouped by country, user-agent, campaign, advertiser or publisher;
- Provide combination of two or more of the dimensions above at point 2.;
- Receive queries and new data at the same time, without any impacts on performance;
- Have one hour as time granularity;
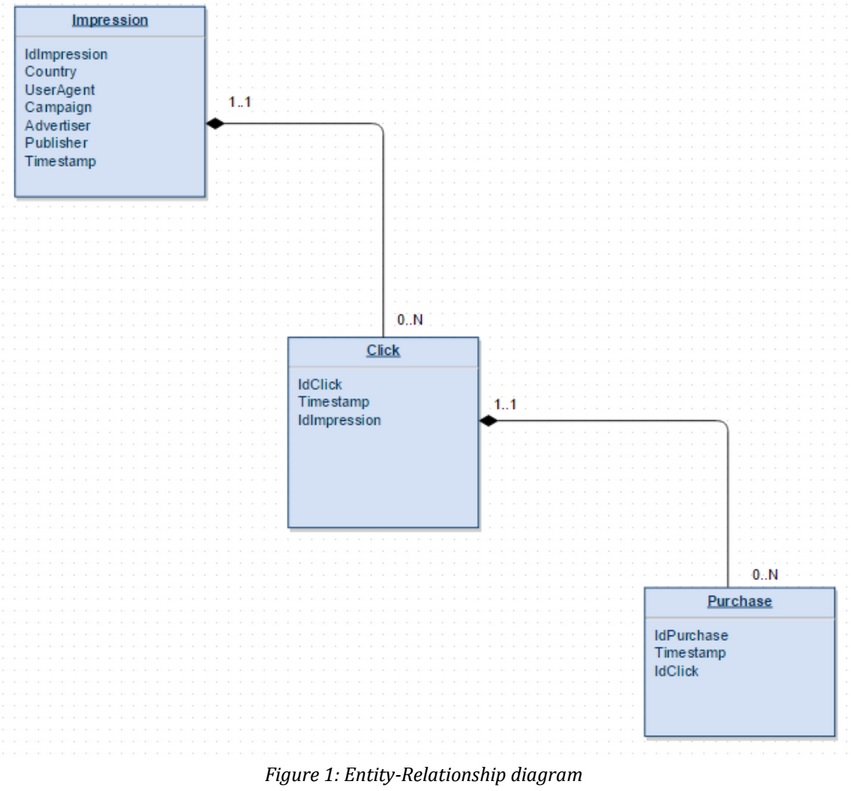
The Entity-Relationship diagram is designed using the composition relation (instead of aggregation) to emphasize the strong link between these three entities.
Due to this choice, a Click could not exist without its “parent impression” in the same way a Purchase could not exist without its “parent Click”.
Regarding to the cardinality, a single Impression can lead to multiple Clicks (0..N) but every Click must be generated by a single Impression (1..1); Click and Purchase are ruled by the same cardinality behavior.
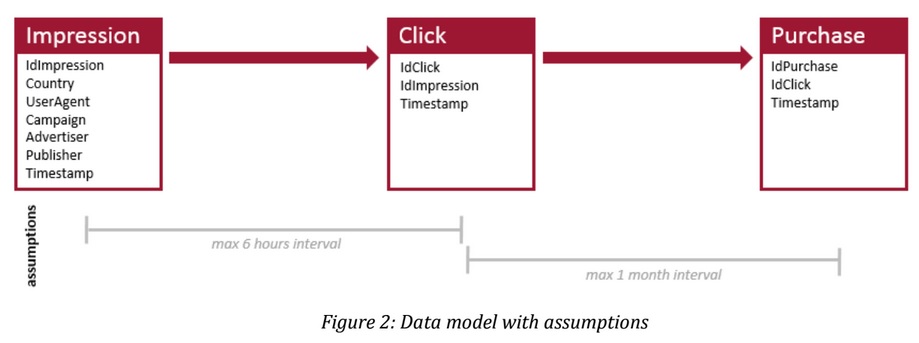
The following schema shows the assumptions that exist between Impression, Click and Purchase.
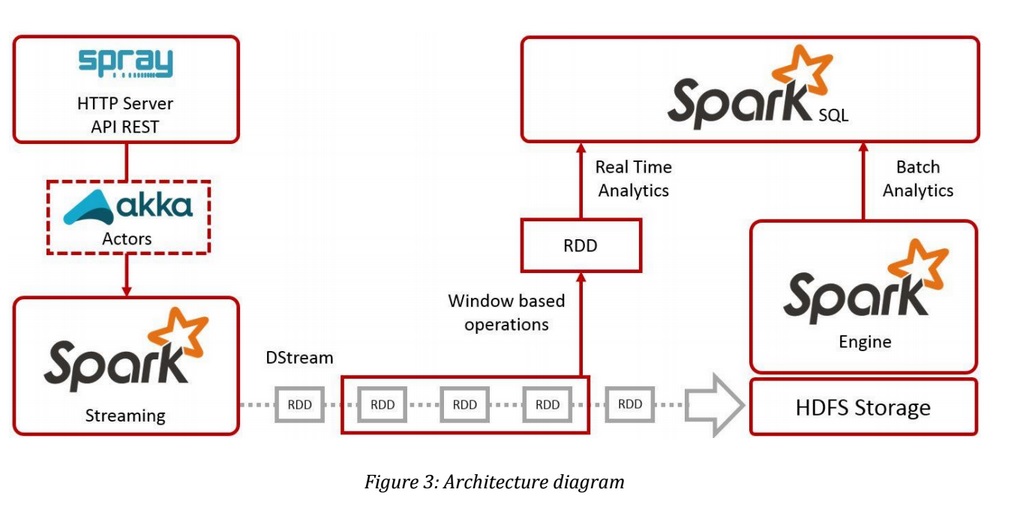
- Akka
- asynchronous and distributed design;
- remote and/or local supervisor hierarchies;
- actors are lightweight;
- Spray
- flexible, asynchronous and actor-based REST API on top of Akka;
- HDFS
- distributed and fault tolerant file system;
- Spark
- Spark Streaming
- can handle Akka actors messages;
- provides window based operation for real-time analytics;
- Spark Engine
- process data in-memory for batch based analysis;
- Spark SQL
- engine for interactive or long queries;
- provides JDBC and ODBC connectivity;
- Spark Streaming
Spark thrift server functionality can also be used to allow external tools to create some data visualization.
implicit val system = ActorSystem("LocalSystem")
val localActor = system.actorOf(Props[LocalActor], name = "LocalActor")
localActor ! "START"

startServer("localhost", port = 8082) {
    get {
        path("api") {
        parameters('id_impression, 'country, 'campaign, 'advertiser, 'publisher) { (id_impression, country, campaign, advertiser, publisher) =>
           val timestamp = Calendar.getInstance().getTime()
           localActor ! s"$id_impression,$country,$campaign,$advertiser,$publisher,$timestamp"
           complete(s"Sample impression response")
        }
      }
   }
}
class LocalActor extends Actor {
    val remote =
context.actorSelection("akka.tcp://sparkDriver@SparkMaster:7777/user/Supervisor0/receiver")
   def receive = {
       case "START" =>
             remote ! "Spray API server has started"
       case msg: String =>
             remote ! s"$msg"
  }
}
val ssc = new StreamingContext(conf, Seconds(30))
val actorName = "receiver"
val actorStream = ssc.actorStream[String](Props[Receiver], actorName)
// window based operations
val impressions = actorStream.window(Seconds(600), Seconds(30))
impressions.foreachRDD((rdd: RDD[String]) => {
   // some RDD operation for each window
}
)
val impressions = impressionData.map(x =>
(x.split(';').lift(0).get,x.split(';').lift(1).get,x.split(';').lift(2).get))
 .map({case (impressionId,country,timestamp) => (impressionId)->(impressionId,country,timestamp)})

val clicks = clickData.map(x =>
(x.split(';').lift(0).get,x.split(';').lift(1).get,x.split(';').lift(2).get))
 .map({case (clickId,timestamp,impressionId) => (impressionId) -> (clickId,timestamp,impres-
sionId)})

val joined = impressions.join(clicks).map(x=>x._2)

val resultByCountry = joined.map(x => (x._1.productElement(2)
 ,getMinutesDiff(x._1.productElement(3).toString,x._2.productElement(1).toString)))
 .filter(x => x._2 <= 360) // 6 hours interval filter
 .countByKey()
- Fine tuning of Spark jobs: to pick the most efficient actions and transformations in terms of computational performance;
- Apache Kafka or Apache Flume: to add durability and reliability to data collected through the APIs.


